Table 1:
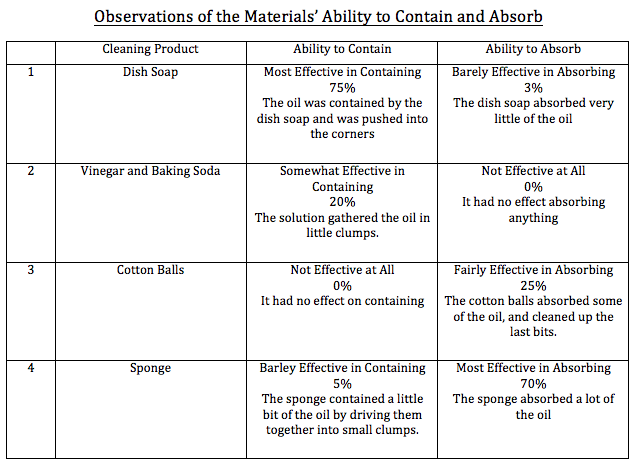
Figure 1:
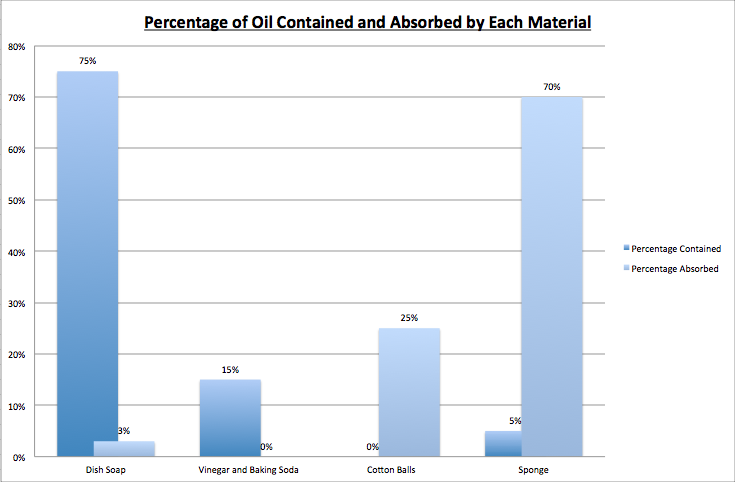
Figure 2:
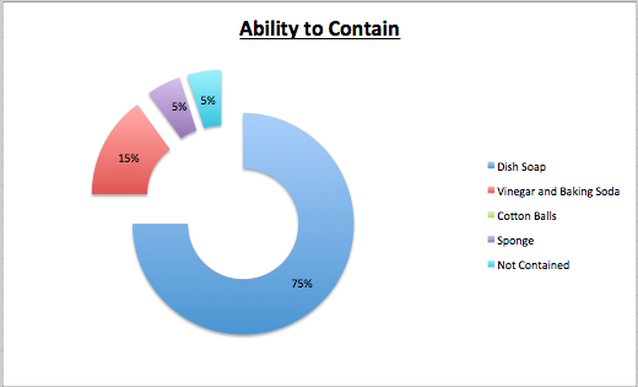
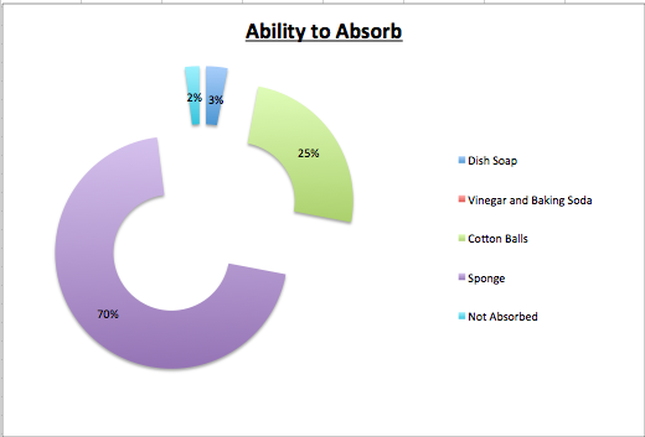
Figure 3:
In Table 1, there is a table of the observations of the ability the materials have to contain and/or to absorb the oil. There is an estimated percentage of how much oil was contained and/or absorbed.
In Figure 1, there is a graph representing the percentage of oil absorbed and/or contained by the different materials.
In Figure 2, there is a pie chart representing the percentage of oil contained by the materials.
In Figure 3, there is a pie chart representing the percentage of oil absorbed by the materials.
